Contributor: Yanjun Xia, Simerics Inc.; George Maddox, Best PumpWorks; Sam Lowry, Simerics Inc.; CFturbo
ABSTRACT
An example of the complete process used by PumpWorks 610, LLC in designing and optimizing a vertical turbine pump is presented, starting with the creation of an initial prototype using the design software CFturbo, and the subsequent virtual testing and analysis with the CFD tool PumpLinx. The results of the CFD analysis are used to identify the sources of loss of efficiency, with specific examples of how those losses are identified. The geometry of the pump is then modified to improve performance and re-tested in the virtual environment before any hardware is manufactured. Once built, the predicted performance of the optimized pump is verified by physical testing. Comparisons between the CFD predictions and the empirical data are presented. Once demonstrated to perform as intended, the final design is delivered to the customer.
NOMENCLATURE
ρ Fluid density
ρl Liquid density
ρv Vapor density
ρg Gas density
fl Mass fractions of the liquid phase
fv Mass fractions of the vapor phase
fg Mass fractions of the non-condensable gas phase
Ω Computational domain
v Velocity vector
v Velocity magnitude
n Surface normal
S Surface of computational domain
τ Shear stress tensor
P Pressure
Pt Total pressure
Ps Static pressure
f Body force vector
k Turbulence kinetic energy
ε Turbulent dissipation rate
f Vapor mass fraction
Df Diffusivity of vapor mass fraction
σf Turbulent Schmidt number
1 INTRODUCTION
Computer-Aided Design (CAD) and Computer-Aided Engineering (CAE) tools are widely available in many industrial fields, including automotive, hydraulic machinery, oil and gas, and power plants. A combination of these tools can greatly reduce product design and development cycle and cost, but raises the question of how to best apply them effectively.
In general, the development of an optimized mechanical system involves a cycle of design, testing, analysis, and redesign, repeated as needed until the desired performance is achieved. The function of CAE tools falls into one or more of the above categories.
Design tools produce an initial concept based on established design rules, empirical correlations and analytical functions to produce a prototype targeted for prescribed specifications. These specifications include geometrical constraints and performance goals. In a perfect world, the first prototype would meet all specifications and be ready to deliver to the customer, but in reality subsequent testing, analysis and redesign are usually required.
In the past, testing was done on physical hardware requiring time and money and producing engineering output restricted by the inherent limitations and difficulty of instrumentation. Fortunately, recent developments in Computational Fluid Dynamics (CFD) simulations have enabled CFD models that can accurately predict performance through virtual testing, in lieu of manufacturing the hardware and building test stands. This is not to say that CFD simulations can completely replace physical tests; however, new software and numerical techniques represent a virtual testing framework with which the cost of physical testing can be minimized, and unique insight into product improvement can be realized.
As with physical testing, the design engineer is faced with the challenge of how to analyze and interpret the data from a virtual test to determine how best to improve the design. In the future, this process may also be automated, but for the present, the analysis and optimization of new designs is primarily achieved through application of the knowledge and judgment of an engineer in the loop.
The following articles provide an example of the design, testing, analysis, and redesign process for the successful development of a commercial vertical turbine pump.
2 PRELIMINARY DESIGN USING CAE
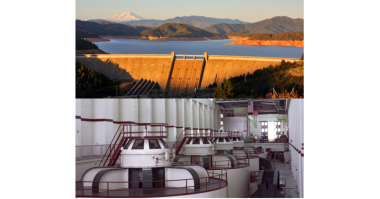
For this project, the designers were tasked with developing a vertical turbine pump for use as a 3-stage crude oil booster pump used to supply crude oil to high pressure main line multistage pumps for pipeline transport. The rated condition of the pump is 250ft head at 4725GPM flow rate while operating at a speed of 1780 RPM.
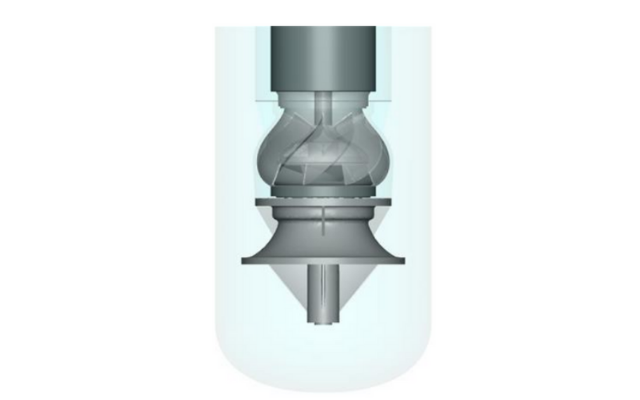
Starting with the design specifications, a preliminary design for the first stage suction bowl, impeller and diffuser was created in the turbomachinery design package CFTturbo® as shown in Fig. 1. The initial inputs consist of global parameters which include the design flow, speed, fluid, rotation, estimated case efficiency, and inflow angle. The next step is to calculate the main impeller dimensions by inputting a value for the suction specific speed which dictates the eye diameter, work coefficient which dictates the outer diameter, and the exit width ratio, which dictates the exit width. After completing these steps, the design process continues with the development of the meridional view, the blade properties, and the blade mean lines. The hydraulic design engineer has the option of selecting the default design or adjusting the default values as necessary to meet the design specification and optimize the design based on individual experience and sound pump design theory fundamentals and principles.
Several CAE turbomachinery design tools, such as CFturbo®, offer preliminary predictions of the pump performance based on empirical correlations, analytical functions, or in some cases simplified CFD. These predictions are useful indications of the potential performance, but should be viewed with extreme caution, since they typically do not include important effects such as aeration, cavitation, three-dimensional geometrical complexities, or transient phenomena. Even those commercial design codes that include rudimentary CFD are usually limited to single passages, steady-state analysis and/or simplified physics. As such, a CFD tool with the capability to solve for the full physics, complete geometry and transient effects is required for accurate prediction of the performance.
In order to rigorously test the initial prototype, the geometry created during the design phase is transferred to a CFD code with full capability in terms of physical models and numerical capability to conduct virtual testing that will provide accurate performance data over the full operating range.
3 VIRTUAL TESTING WITH CFD
In addition to using a CFD simulation tool with adequate capability, achieving accurate predictions of a new pump requires that design engineer adheres to the following critical steps:
- Inclusion of all relevant physics
2. Proper selection of domain and boundary conditions
3. Inclusion of Geometric details
4. Transient calculations
3.1 Relevant Physics
In addition to solving for viscous flow in three- dimensions, a virtual simulation tool for pumps should include liquid compressibility, cavitation and aeration. CFD simulations used to be simplified assuming incompressible liquid with constant properties. However, in reality, liquid density can vary due to liquid compressibility, cavitation and aeration.
Cavitation, the process of vapor formation in reduced pressure zones, is often a problem and a design consideration for a broad range of turbomachinery since it is often followed by the subsequent implosions of the vapor bubbles as they flow into areas of higher pressure. It can lead to degraded performance, undesired noise in the system, and physical damage to the hardware.
Aeration can also cause problems. Aeration refers to the presence of non-condensable gases (NCGs) in the primary liquid, most commonly, air in water or oil. The presence of the NCGs coming out of solution, expanding, and/or contracting in the primary liquid can have considerable impact on the performance of the machinery. Thus it is important to include the effects of aeration too.
In order to account for these phenomena, a full cavitation model proposed by Singhal et al. (Ref. [1-2]) describing the air and vapor distribution is solved:
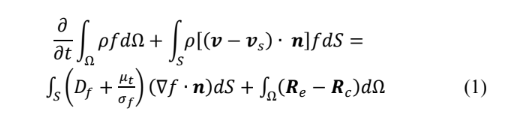
Where Df is the diffusivity of the vapor mass fraction f, σf is the turbulent Schmidt number, Re and Rc represent the vapor generation and condensation rates.
The density of the mixture ρ is calculated by:
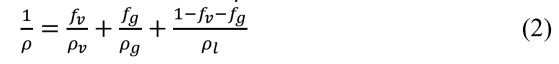
Where ρl, ρv and ρg is respectively the liquid density, the vapor density and non-condensable gas density; and fl, fv and fg are the mass fractions of the liquid phase, vapor phase and non condensable gas.
3.2 Simulation Domain
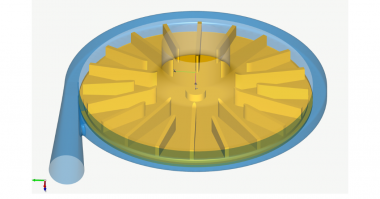
To accurately recreate the physical testing process, it is critical to include a sufficiently extensive simulation domain for realistic virtual testing of the system. Historically, CFD analysts simplified large models in order to keep the simulation set up and computational times practical. In some cases, the user had to over simply the problem by reducing the flow to a single passage, thereby omitting important cross-over effects. The only simplification for the current application is to limit the model to the first stage. This assumes that each subsequent stage will have similar performance characteristics. The model created includes the suction bowl, impeller and diffuser in full 3-D, with the solution domain boundaries sufficiently removed from the inlet and outlet of the stage to avoid any unrealistic influence of the boundary conditions on the flow inside the pump, as shown in Fig. 2.
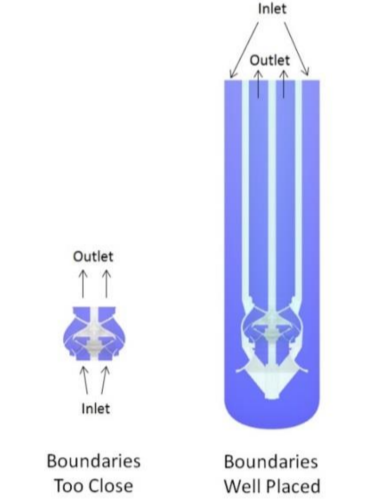
Figure 2. Domain Selection
3.3 Geometric Detail
In addition to including sufficient extent of the geometry, sufficient detail was included to account for the often important effects of tight clearances and leakage paths. An automatically generated binary tree mesh is used to capture the wide range of length scales and details inherent in the pump. Figure 3 shows an example detail captured in the diffuser stage. Such features can have a significant effect on the flowrate, head rise, loads and efficiencies of the pump and should be included.
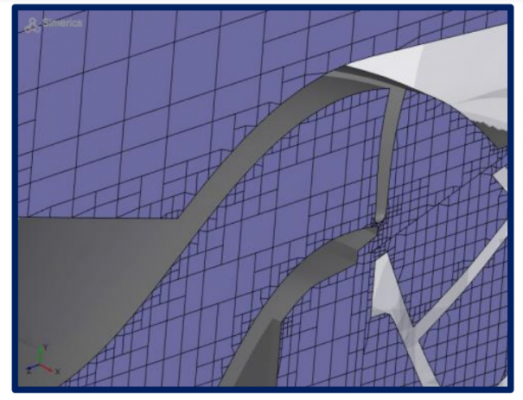
Figure 3. Details In The Model
3.4 Transient Simulation
Transient effects, such as blade-stator interaction, pressure ripples, dynamic loads, and cavitation/aeration, can only be captured by transient simulations. The less accurate alternative is a time-averaged quasi-steady state calculation, which places the rotor in a rotating reference frame and the rest in the lab frame. To the extent that the pump is axisymmetric and non-pulsating, the quasi-steady calculation provides a good initial approximation and is significantly faster than a transient simulation. But to the extent that the pump is not truly axi-symmetric and may have strong intrinsic instabilities like vortex shedding, or bubble formation and collapse, a steady state simulation in inaccurate. Therefore, despite the more expensive computational cost, it is highly desirable to run transient simulations in conjunction with steady state simulations to more accurately model the real pumps. This requires a simulation code that has sufficient speed to make transient simulations practical, even for large or very complicated systems.
4 VIRTUAL TESTING OF THE ORIGINAL DESIGN
The CFD code used by PumpWorks 610, LLC for virtual testing of their designs is PumpLinx®. For more details about the equations, mesh, and models used in PumpLinx®, please refer to Ding et al.’s paper (Ref [3]). In this process, the initial prototype geometry created in CFturbo® was transferred into PumpLinx via a stereolithography (STL) file. The model was then created based on the guidelines discussed in section 3.
The mesh is generated by an automated, body-fitted binary tree mesh generator, with about 0.7 million grid cells. The sliding/rotating of the meshes are automatically taken care of by the “Centrifugal template” within PumpLinx®. A standard k-ε two equation model is used for turbulence modeling.
A transient simulation is desirable in order to simulate the physics of the pump more accurately. However, to optimize computational expense, the quicker steady state simulation (multi-reference frame simulation) can be run first for this pump to get an approximate estimate of the fluid field inside, which provides the initial condition for the more accurate and time consuming transient simulation.
The fluid properties used in the CFD simulation are based on water at 20 °C, as listed in Table 1.
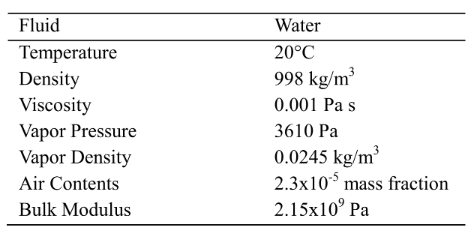
Table 1. Fluid Properties
The pump is designed to operate at 1780 RPM, with an inlet pressure of 136kPa and a range of flowrates up to a capacity of 6000 GPM. These conditions were incorporated into the model and the pump was simulated over the operating range, with the result that the predicted head and efficiency were well below the target values. These low values motivated improving the design. In order to accomplish this, the design engineer first used the CFD results to identify and understand the cause of the poor performance.
5 POST TEST ANALYSIS ( ORIGINAL DESIGN )
The results of the virtual test series for the preliminary design provide a wealth of data for analysis of the pump performance. A primary parameter of interest is the head rise as compared with the target value. The head rise through the pump is determined by the net difference of the total pressure Pt, i.e., the sum of static pressure Ps and dynamic head, at the inlet and outlet:
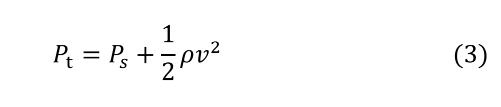
This original design of the pump is predicted to raise the total pressure by 224kPa at 4725GPM, which falls short of the desired value, by an unacceptable 12% percent.
Two other parameters of importance are the power and efficiency. The power supplied to the turbine is an integrated quantity automatically calculated and stored in the simulation. It is worth pointing out that this power is pure fluid power, no mechanical losses are included. Based on the head rise and power input, the calculated efficiency of this prototype is 69%, which is significantly lower than the target efficiency.
Given the under performance of the original design, a natural next step is to examine the system and identify the origins of the losses, so that they can be minimized through improvements of the design.
3.1 Identification of Losses
There are multiple factors that can cause losses, including recirculation, aeration, cavitation, and shear.
- Aeration/Cavitation
- Total pressure losses
- Recirculation (shear)
These potential causes are investigated based on the simulation results.
In PumpLinx, the formation, transport, and collapse of air and vapor bubbles is computed as part of the solution. For this pump, at the given inlet pressure, only very localized cavitation/aeration was predicted for the first stage. Since subsequent stages would be at higher pressures, the effect of air/vapor bubbles would be even smaller. As such, aeration and cavitation are ruled out as the cause of the poor performance.
The next focus of the analysis is to look at total pressure, since it is a good indicator of the energy of the fluid and can be used to map the gains and losses through the pump.
Following the flow path, the pump is divided into three parts: (1) from the inlet to the turbine, (2) from the inlet of the turbine to the entrance of the diffuser, (3) from the diffuser entrance, downstream to the outlet. Figure 4 displays a color map of the total pressure on the two interfaces and pump outlet surface:
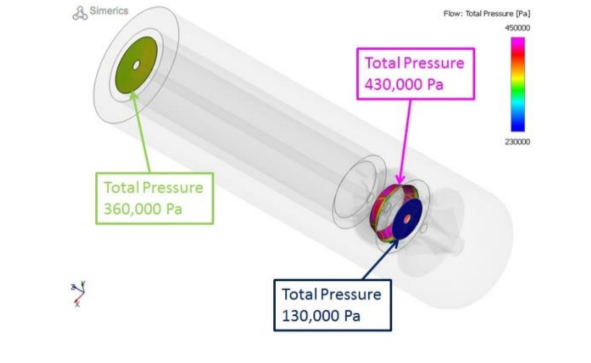
Figure 4. ORIGINAL DESIGN: TOTAL PRESSURES AT THE
TURBINE INLET(130,000 Pa), TURBINE OUTLET(430,000 Pa)
AND PUMP OUTLET(360,000 Pa)
A closer look at the output of the integrated average total pressure on these three surfaces reveals that there is very little energy loss (i.e. a very small drop of total pressure) from the pump inlet to the inlet of the turbine. By the exit of the turbine, the fluid has gained energy corresponding to a total pressure rise of about 300 kPa but then loses 25% of this energy in the diffuser, such that the total energy gain throughout the pump (227 kPa), which is 75.7% of the energy gain through the turbine. Given this loss, the next step is to take a closer look at flows and pressures through the diffuser.
3.2.1 Total Pressure Losses in the Diffuser
Figure 5 displays the total pressure on an axial cutting plane bisecting the turbine (on the right) and the diffuser (on the left). The average flow is right to left through the stage. The magenta color corresponds to a total pressure of 400kPa or above, and the dark blue corresponds to 300kPa or below. Inspection of the color map indicates a dramatic loss of total pressure as the fluid exits the turbine and enters the diffuser. In particular, the blue patches on the downstream side of the diffuser blades indicate regions of total pressure loss.
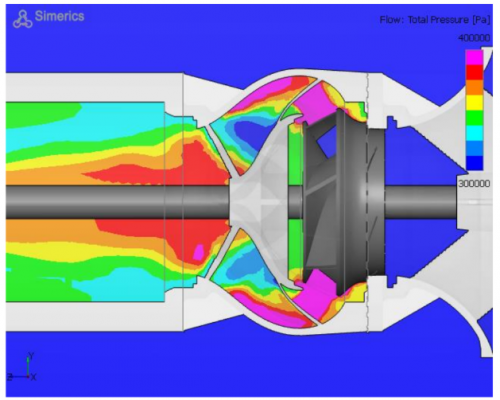
Figure 5. TOTAL PRESSURE ON A CUTTING PLANE
3.2.2 Recirculation Zone in the Diffuser
The mechanism of the loss of total pressure in the diffuser shown in Figure 6 above can be identified by further examination of the simulation results. Displaying the axial component of the velocity (Z-Velocity) on the same cutting plane as in the previous figure reveals significant recirculation in the diffuser section (Fig. 6). Recirculation zones introduce shear and reduce the efficiency by dissipating fluid energy into heat, and can be a source of energy loss. Figure 6 shows the axial velocity in the range of [−8, 8] m/s, such that any region of yellow corresponds to back flow. This recirculation generates dissipative shear within the fluid. In order to improve the performance of the diffuser, it needs to be redesigned to reduce or eliminate these recirculation zones.
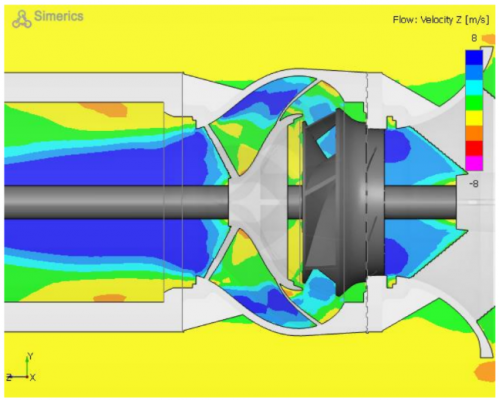
Figure 6. AXIAL VELOCITY ON A CUTTING PLANE
4 THE IMPROVED DESIGN
Once the regions and mechanisms of the losses have been identified, the next step is to improve the design. If design software is available, it can be used to modify the design and then test it using CFD. Alternatively, the engineer can use his or her experience to create a new design in CAD and then test it.
The latter is the approach used for the pump showcased in this article. The initial design was created using the design package CFturbo®. This design was subsequently tested in PumpLinx with the results indicating room for improvement in the diffuser section. The challenge for the diffuser is to smoothly convert the high swirl velocities into lower velocities and static pressure, without losing energy. Based on their understanding of the simulation results, PumpWorks 610 engineers lengthened the stator section in CAD to reduce the separation. After a few trials, finally a much improved design is achieved. The proposed changes were first tested in PumpLinx and then built and verified via hardware tests, confirming the predictions and delivering the desired improvements for the customer.
The virtual test of the new design is conducted as with the original design. A similar close up at the cutting plane (Figure. 7), as shown previously in Fig. 6 reveals that the recirculation zone inside the diffuser bowl has been eliminated in the new design. Hence an improved performance is expected.
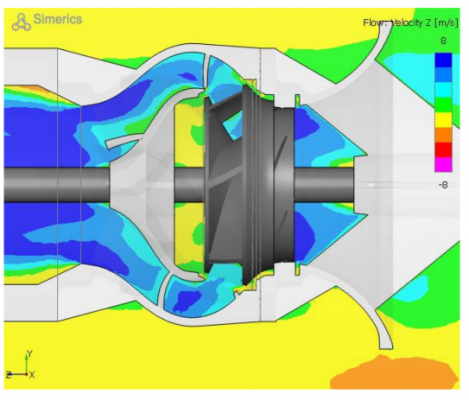
Figure 7. AXIAL VELOCITY ON A CUTTING PLANE
Examination of the predicted performance of the final design at 5000 GPM shows that the predicted head and efficiency have increased to 89 ft and 77.7% respectively, as compared with the predicted values for the original design of THD =78.4 ft and EFF = 69.2 %. This improved performance, if substantiated by physical test, is sufficient to meet the specifications required by the customer.
4.1 Comparison with Physical Testing
Once the design team is satisfied with predicted performance, the new design is then manufactured and physically tested. A three-stage axial pump, each stage being exactly the same, has been used in the test. The test data were converted into the corresponding head and efficiency to those of a fixed rotation rate 1780 RPM, with a fixed suction head 136 kPa, and various capacities ranging from about 1600 GPM to 6000 GPM, through some empirical formulations.
4.2 Simulation Parameters
The fluid properties used in the CFD simulations again are based on water at 20 °C, as listed in Table 1. A mesh of about 0.91 million binary tree cells was used for this new design. 4.3 Simulation Results Compared with Test Data Figure 8 shows a comparison of the predictions between the simulation and the experimental data:
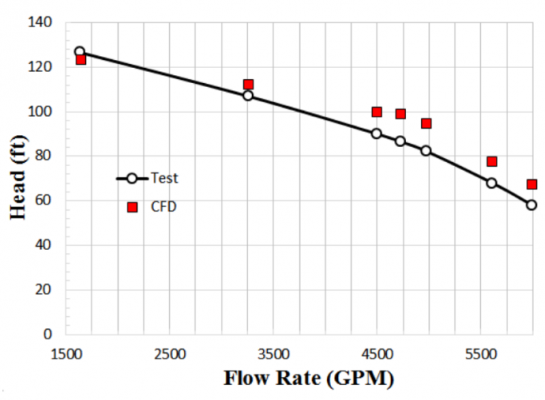
Figure 8. PUMP HEAD COMPARISON.
As the measured pump’s efficiency for the new design meets the target values. The predicted head is within ten percent or better of the measurements over the full operating range. The over prediction of the head is, in part, attributed to the fact that that not all leak paths were included in this model. Leakage losses typically reduce the head by 2-3 percent. Also, some uncertainty is introduced by virtue of the fact that only a single stage is included in the model. From an engineering perspective, the simulations are sufficiently accurate when compared to the real hardware to allow the design engineers to achieve an optimize design.
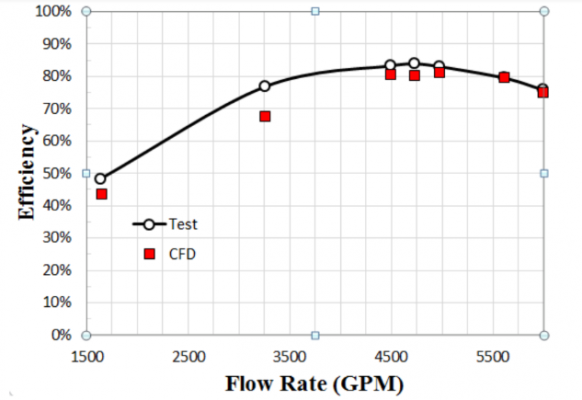
Figure 9. PUMP EFFICIENCY COMPARISON.
5 CONCLUSIONS
With the availability of engineering tools such as CFturbo and PumpLinx, Pumpworks 610, LLC is able to reduce the design time and cost associated with the development of new high performance products and optimization of existing products. With the aid of these tools, the design engineers were able to identify and address secondary flow losses in the diffuser for the above vertical turbine pump and quickly make the design changes necessary to meet the customer’s performance requirements and deliver the equipment on time.
REFERENCES
[1] Singhal A., Athavale M., Li H., and Jiang Y. 2002. “Mathematical Basis and Validation of the Full Cavitation Model”, Journal of Fluids Engineering. September 2002, vol. 124.
[2] Athavale M., Li H., Jiang Y. and Singhal A. 2002. “Application of the Full Cavitation Model to Pumps and Inducers”, International Journal of Rotating Machinery, 8(1), pp. 45-56
[3] Ding, H., Visser, F., Jiang, Y. and Furmanczyk M. 2011. “Demonstration and Validation of a 3D CFD Simulation Tool Predicting Pump Performance and Cavitation for Industrial Applications”, Journal of fluids engineering. January 2011, vol. 133.
[4] Jiang, Y., Zhang D., Furmanczyk, M., Lowry, S. and Perng, C. 2008. “A three-dimensional design tool for crescent oil pumps”. SAE World Congress, April 14-17, Detroit, MI, Paper No.SAE-2008-01-0003
Hi,
The loss of energy in pumps with axial flow could be 50% reduced by the incorporation of a renewable energy resource (RES) to the system. This RES improves the dynamic of the flow, balance the loss of energy that always will be present and the efficiency of the pump high increase.
I am working on this topic for more than ten years and for more than three years with Texas A&M University.
I could provide you with more information if you would like.
I am open to any additional cooperation to develop this inedited designs.
Thank you for this possibility.