Author: Bob Latino CEO at Reliability Center, Inc.
ORIGINAL POST 6.2.17 (ID# Shaft.6.2.17)
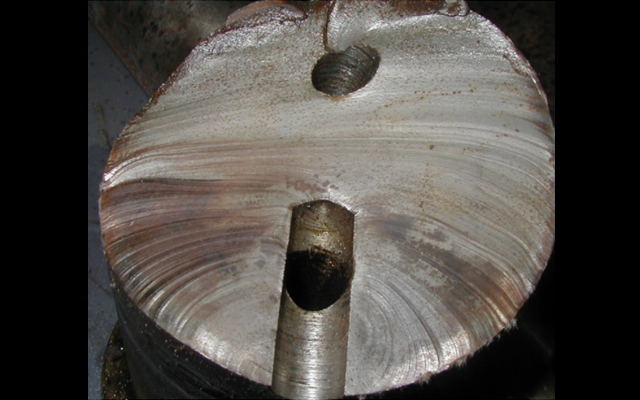
Can you identify and name this fracture pattern?
How can you tell it is that fracture pattern?
Where are the origin(s) of the failure on the fractured surface?
How can you tell where the origin(s) are?
As usual, we will use the collective experience and expertise of our viewers to educate each other, and to increase awareness to the extensive value of preserving failed parts and to the amazing skills of metallurgists!
We will post the answers to these questions in a week or so, but I suspect the input we will get from our metallurgical friends will provide all the answers we need:-)
FOLLOW UP POST 6.5.17 (Provided by Mark Latino, Sr. Investigator, RCI)
Thanks for the excellent responses from our obviously seasoned, metallurgical veterans. Given the limited information everyone was provided, they had to make a preliminary call based only on the evidence of the fracture surface. The consensus was spot on. Thanks for your willingness to share your expertise to those who may see failed parts all the time, but not know how to read the surfaces. This gives them a whole new appreciation for the value of saving failed parts.
The nusthell answer: High cycle fatigue due to rotational bending.
How does one know this? For those who are not metallurgists or materials engineers, we’ll go over the basics. The origins of the fracture can be traced back to where the progression marks started. Some people call them ‘progression marks’, ‘beach marks’ or ‘clam shell marks’, but they are all the same thing.
As the high cycle fatigue continues and the progression marks become larger and larger, the final fracture zone (also call instantaneous zone) can no longer absorb the load and fails in an overload pattern.
The size of the final fracture zone (vertical blue lines) determines the degree of loading at the time of the failure. A larger final fracture zone indicates a high load was present. Conversely, a smaller final fracture zone indicates a light load present at the time.
The distance between the progression lines (horizontal red lines) indicates the magnitude of the cyclic stresses. The greater the distance between the progression lines, the higher the load.
How did our experts know there was rotational bending? In this case, the progression mark patterns went in a counterclockwise direction. The final fracture zone was located at the opposite side of the origin, indicating rotational bending.
While these basic explanations are ‘Metallurgy 101’ to our experts who have kindly participated, it is to all of our advantage to educate those on the front lines who often are the first to see such failed parts. This is because if they understand how important preserving such parts are to an investigation, they are more likely to do so. Better yet, if they have a basic understanding of how to read fractured surfaces, they will become a part of the investigative process by trying to make their own ‘call’ on what caused the physics of the failure. Then they will want to participate just because of their own curiosity and that is a win all the way around:-) Thanks everyone for making these blogs fun to participate in, as well as educational.
 Below are some additional resources:


Comments