Does it really make sense to increase the efficiency of your pump and motor without addressing the downstream components? What is the value (payback) of a premium efficiency motor VS a standard efficient motor? Is it really worth replacing a 70 percent efficient pump with a 75% efficient unit? Some people would think this is a no brainer.
There are a number of factors that should be taken into account before replacing a motor or pump. Let’s put this approach in perspective. Would you purchase the most fuel efficient car on the market (to reduce your energy cost) then drive it with the parking brake on? I hardly think so. In simplistic terms, that is component efficiency, gaining efficiency in one area while wasting the energy generated in another. I have prepared a simple spread sheet that provides in detail the benefits of system efficiency VS component efficiency.
 Figure 1
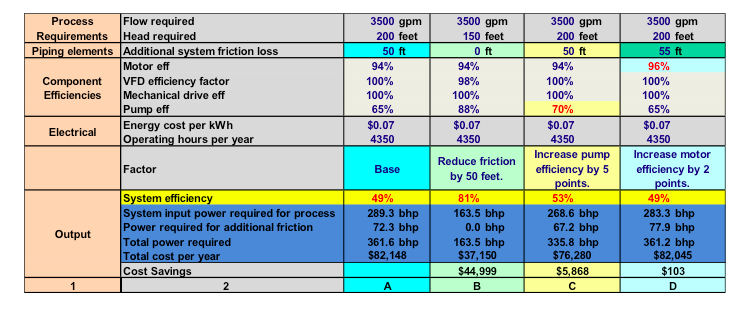
Figure 1 provides four separate scenarios for a given pumping system. The system portrayed is a typical application where the discharge is being throttled over a range of operation. The system in this example operates 24/7, 365 day a year and at this particular load point 50% of the time or 4350 hours per year.
Columns One and Two indicate the various components factored into the system efficiency calculation. Column A is the base condition where the system operates 50% of the time. You will note the component efficiencies for the VFD and gearbox at 100% since they were not utilized. Under the based condition the system the total power required is approximately 362hp, almost 73hp is being lost (wasted) across a throttling valve. In addition, the pump is operating back on the curve at 65% efficiency. Under these conditions the total system efficiency is 49%.
Column B provides total the new operating conditions with the addition of a variable frequency drive. The head required has been reduced to 150’ since the loss across the valve has been eliminated by reducing the speed of the pump to meet required system demand. Motor efficiency remains the same a 2% loss has been added due to heat generated across the drive. Observe the dramatic improvement in the overall system efficiency (81%) and the total operating cost reduction from $82,148 to $37,150 = cost savings of $44,999 per year. Not to mention the improved reliability and subsequent reduction in maintenance cost and increased productivity.
Column C addresses the impact on the system by improving the efficiency of the pump. Nothing else in the system was changed. Note the minimal improvement of the overall system efficiency (53%) by increasing the pump efficiency 5%. The 50’ head loss across the valve remain therefore the total power required is 336hp. Not much of a saving based on the cost of a new pump, installation cost and potential piping changes. Factor in the ongoing reliability issues (pump is still operating back on the curve the $5,868 dollars would be very difficult to justify.
Column D identifies potential savings when motor efficiency is improved by 2%. Again nothing has changed in the system with the exception of an additional 5 feet of friction loss across the valve as a result of the reduced slip in the premium efficiency motor (head increases to the square of the speed). In this case, the system efficiency remains the same at 49%. Note the power required for the additional friction has increased to 77.9hp. The total power required was reduced to 361.2hp (a reduction of .4hp) with a total savings of $103 dollars per year.
Now add the increased maintenance cost due to the pump operating away from BEP (you’re driving the energy efficient car with the parking brake on) and the component efficiency approach looks even less attractive.
I think it goes without saying, but I’ll say it anyway, think system!


[…] Article by: William Livoti. This article was also published on the Empowering Pumps blog […]